|
Expansion
of Hong Kong |
|
Construction Phase Quarterly EM&A Report No.6 (1 April to 30 June 2017) |
Contents
The “Expansion of Hong Kong International
Airport into a Three-Runway System” (the Project) serves to meet the future air
traffic demands at Hong Kong International Airport (HKIA). On 7 November 2014,
the Environmental Impact Assessment (EIA) Report (Register No.: AEIAR-185/2014)
for the Project was approved and an Environmental Permit (EP) (Permit No.:
EP-489/2014) was issued for the construction and operation of the Project.
Airport Authority Hong Kong (AAHK) commissioned
Mott MacDonald Hong Kong Limited (MMHK) to undertake the role of Environmental
Team (ET) for carrying out the Environmental Monitoring & Audit (EM&A)
works during the construction phase of the Project in accordance with the
Updated EM&A Manual.
This is the 6th Construction Phase
Quarterly EM&A Report for the Project which summarizes the monitoring
results and audit findings of the EM&A programme during the reporting
period from 1 April 2017 to 30 June 2017.
Key Activities in the Reporting Period
Key activities of the Project carried out in
the reporting period included deep cement mixing (DCM) trials and works, laying
of geotextile and sand blanket, site office establishment, horizontal
directional drilling (HDD) works, and submarine cable diversion associated
works.
EM&A Activities
Conducted in the Reporting Period
The EM&A programme was
undertaken in accordance with the Updated EM&A Manual of the Project. A
summary of the monitoring and audit activities during this reporting period is
presented as below. Construction works on Sheung Sha Chau Island was suspended
during the ardeid’s breeding season (between April and July). The ecological
monitoring is therefore suspended.
|
Monitoring/ Audit Activities |
Number of Sessions |
|
1-hour Total Suspended Particulates (TSP) Air Quality Monitoring |
105 |
|
Noise Monitoring |
65 |
|
Water Monitoring |
37 |
|
Vessel line-transect surveys for Chinese White Dolphin (CWD) monitoring |
6 |
|
Land-based theodolite tracking survey effort for CWD monitoring |
15 |
|
|
|
|
|
Marine Traffic Control Centre (MTCC) in Operation in the Site Office |
Photo Shoot for Photo Identification of CWD |
Chemical Spill Drill conducted by the Contractor |

In total, 2,543 ferry movements
between HKIA SkyPier and Zhuhai / Macau were audited in the reporting period.
Except one High Speed Ferry (HSF), all HSFs travelled through the Speed Control
Zone (SCZ) with average speed within 15 knots, which complied with the Marine
Travel Routes and Management Plan for High Speed Ferries of SkyPier (the
SkyPier Plan). Nine ferry movements had minor deviations from the diverted route during the reporting period. ET investigated the
speeding and deviation cases and all of them are related to public safety /
emergency situations. Three meetings were held with ferry operator (FO)
representatives in the reporting period to review and discuss the deviation
cases as well as to share experience and recommendations to further strengthen
the implementation of the SkyPier Plan.
On the implementation of the Marine Travel
Routes and Management Plan for Construction and Associated Vessel (MTRMP-CAV),
the upgraded Marine Surveillance System (MSS) launched in March 2017
automatically recorded deviation cases such as speeding, entering no entry
zone, and not travelling through the designated gates. ET conducted bi-weekly
audit of the system to ensure sufficient information has been provided and the
contractors complied with the requirements of the MTRMP-CAV. Trainings were
provided for the concerned skippers to facilitate them in familiarising with
the requirements of the MTRMP-CAV. Deviations including speeding in the works
area, entry from non-designated gates and entering no-entry zones were reviewed
by ET. All the concerned captains were reminded by the contractor’s MTCC
representative to comply with the requirements of the MTRMP-CAV. Monthly
3-month rolling vessel plan for construction-related vessels were provided by contractors for checking to ensure the
proposed deployment is necessary and minimal.
On the implementation of Marine Mammal Watching
Plan (MMWP), silt curtains were in place by the contractors for sand blanket
laying works and dolphin observers were deployed in accordance with the plan.
On the implementation of Dolphin Exclusion Zone (DEZ) Plan, teams of at least
two dolphin observers, were deployed at 9 to 13
dolphin observation stations for continuous monitoring of the DEZ by the
contractors for DCM and water jetting works for submarine cable diversion in
accordance with the DEZ Plan. Trainings for the proposed dolphin observers were
provided by the ET prior to the aforementioned works, with the training records
kept by the ET. From the contractors’ MMWP observation records and DEZ
monitoring records, no dolphin or other marine mammals were observed within or
around the silt curtains or the DEZs in this reporting period. Audits of
acoustic decoupling for construction vessels were also carried out by ET.
Review of Environmental Quality
Performance Limits (Action and Limit levels)
Three Limit Level exceedance
cases of 1-hour total suspended particulate (TSP) were recorded in the
reporting period, and the corresponding investigations were conducted
accordingly. The investigation findings concluded that the exceedances were
likely due to the adverse ambient air quality, but not due to the Project.
The water quality monitoring results for total
alkalinity obtained during the reporting period did not exceed their
corresponding Action and Limit Levels stipulated in the EM&A programme for
triggering the relevant investigation and follow-up procedures under the
programme if being exceeded. For DO, turbidity, suspended solids (SS),
chromium, and nickel, some of the testing results exceeded the relevant Action
or Limit Levels in the reporting period, and the corresponding investigations
were conducted accordingly. The investigation findings concluded that the
exceedances were not due to the Project.
No breach of Action or Limit Levels in relation
to construction noise, waste and CWD monitoring was recorded during the
reporting period.
Implementation Status and Review of Environmental Mitigation Measures
Weekly site audits were carried out
during the reporting period to confirm the implementation measures undertaken
by the contractors. Environmental issues related to construction activities,
including construction dust, construction noise, construction waste, and CWD
were monitored and/or reviewed.
Recommended environmental mitigation measures,
as included in the EM&A programme, were implemented properly during the
reporting period. The EM&A programme effectively monitored the construction
activities and ensured proper implementation of the mitigation measures.
Summary Findings of
the EM&A Programme
The following table
summarizes the key findings of the EM&A programme during the reporting
period:
|
|
Yes |
No |
Details |
Analysis / Recommendation / Remedial Actions |
|
Breaches of Limit Level^ |
|
ü |
No project-related Limit Level exceedance was recorded. |
Nil |
|
Breaches of Action Level^
|
|
ü |
No project-related Action Level exceedance was recorded. |
Nil |
|
Complaints Received |
ü |
Three complaints were received on 24 April, 9 May, and 22 May 2017 respectively. |
Complaint investigations were carried out in accordance with the Complaint Management Plan. The investigation details are presented in S3.2.1. |
|
|
Notification of any summons and status of prosecutions |
ü |
|
Summons were received in June 2017 regarding the aviation fuel pipeline diversion works in December 2016. |
Judicial process underway. |
|
Changes that affect the EM&A |
|
ü |
There was no change to the construction works that may affect the EM&A |
Nil |
Remarks: ^Only
exceedance of Action or Limit Level related to Project works is counted as
Breaches of Action or Limit Level.
1 Introduction
1.1
Background
On 7
November 2014, the Environmental Impact Assessment (EIA) Report (Register No.:
AEIAR-185/2014) for the “Expansion of Hong Kong International Airport into a
Three-Runway System” (the Project) was approved and an Environmental Permit
(EP) (Permit No.: EP-489/2014) was issued for the construction and operation of
the Project.
Airport Authority Hong Kong (AAHK) commissioned
Mott MacDonald Hong Kong Limited (MMHK) to undertake the role of Environmental
Team (ET) for carrying out the Environmental Monitoring & Audit (EM&A)
works during the construction phase of the Project in accordance with the
Updated EM&A Manual (the Manual) submitted under EP Condition 3.1. The
Manual is available on the Project’s dedicated website (accessible at: http://env.threerunwaysystem.com/en/index.html).
AECOM Asia Company Limited (AECOM) was employed by AAHK as the Independent
Environmental Checker (IEC) for the Project.
The Project covers the expansion of the
existing airport into a three-runway system (3RS) with key project components
comprising land formation of about 650 ha and all associated facilities and
infrastructure including taxiways, aprons, aircraft stands, a passenger
concourse, an expanded Terminal 2, all related airside and landside works and
associated ancillary and supporting facilities. The existing submarine aviation
fuel pipelines and submarine power cables also require diversion as part of the
works.
Construction of the Project is to proceed in
the general order of diversion of the submarine aviation fuel pipelines,
diversion of the submarine power cables, land formation, and construction of
infrastructure, followed by construction of superstructures.
The updated overall phasing programme of all
construction works was presented in Appendix A of the Construction Phase
Monthly EM&A Report No. 7 and the contract
information was presented in Appendix A of the Construction Phase Monthly
EM&A Report No.15.
1.2 Scope of this Report
This is the 6th Construction Phase
Quarterly EM&A Report for the Project which summarizes the key findings of
the EM&A programme during the reporting period from 1 April 2017 to 30 June
2017.
1.3 Project Organisation
The Project’s organisation structure and the
contact details of the key personnel are provided in Appendix A and Table 1.1
respectively.
Table 1.1: Contact Information of Key Personnel
|
Party |
Position |
Name |
Telephone |
|
Project Manager’s Representative (Airport Authority Hong Kong) |
Principal Manager, Environment |
Lawrence Tsui |
2183 2734 |
|
Environmental Team (ET) (Mott MacDonald Hong Kong Limited) |
Environmental Team Leader |
Terence Kong |
2828 5919 |
|
|
Deputy Environmental Team Leader |
Heidi Yu |
2828 5704 |
|
|
Deputy Environmental Team Leader |
Keith Chau |
2972 1721 |
|
Independent Environmental Checker (IEC) (AECOM Asia Company Limited) |
Independent Environmental Checker |
Jackel Law |
3922 9376
|
|
|
Deputy Independent Environmental Checker |
Joanne Tsoi |
3922 9423 |
|
Advanced Works: |
|
|
|
|
Contract P560(R) Aviation Fuel Pipeline Diversion Works (Langfang Huayuan Mechanical and Electrical Engineering Co., Ltd.) |
Project Manager
|
Wei Shih
|
2117 0566
|
|
Environmental Officer |
Lyn Lau |
5172 6543 |
|
|
Contract 3212 11kV Submarine Cable Diversion |
Project Director |
Colman Chan |
6193 4729 |
|
|
Environmental Officer |
Samantha Kong |
3995 8141 |
|
DCM Works: |
|
|
|
|
Contract 3201 DCM (Package 1) (Penta-Ocean-China State-Dong-Ah Joint Venture) |
Project Director
|
Tsugunari Suzuki
|
9178 9689 |
|
|
Environmental Officer |
Sze Ming Chan |
9384 5494 |
|
Contract 3202 DCM (Package 2) (Samsung-BuildKing Joint Venture) |
Project Manager
|
Ilkwon Nam
|
9643 3117 |
|
|
Environmental Officer |
Dickson Mak |
9525 8408 |
|
Contract 3203 DCM (Package 3) (Sambo E&C Co., Ltd.) |
Project Manager
|
Seong Jae Park
|
9683 8693 |
|
|
Environmental Officer |
Calvin Leung |
9203 5820 |
|
Contract 3204 DCM (Package 4) (CRBC-SAMBO Joint Venture) |
Project Manager
|
Kyung-Sik Yoo
|
9683 8697
|
|
|
Environmental Officer |
Kanny Cho |
9724 6254 |
|
Contract 3205 DCM (Package 5) (Bachy Soletanche - Sambo Joint Venture) |
Deputy Project Director |
Min Park |
9683 0765 |
|
|
Environmental Officer |
Margaret Chung |
9130 3696 |
|
Reclamation Works: |
|
|
|
|
Contract 3206 (ZHEC-CCCC-CDC Joint Venture) |
Project Manager |
Kim Chuan Lim |
3693 2288 |
|
|
Environmental Officer |
Kwai Fung Wong |
3693 2252 |
1.4
Contact information for the Project
The contact information for
the Project is provided in Table 1.2. The public can contact us through
the following channels if they have any queries and comments on the environmental
monitoring data and project related information.
Table 1.2: Contact Information of the Project
|
Channels |
Contact Information |
|
Hotline |
3908 0354 |
|
|
|
|
Fax |
3747 6050 |
|
Postal Address |
Airport Authority Hong Kong HKIA Tower 1 Sky Plaza Road Hong Kong International Airport Lantau Hong Kong Attn: Environmental Team Leader Mr Terence Kong c/o Mr Lawrence Tsui (TRD) |
1.5
Summary of Construction Works
Key activities of the Project carried out in
the reporting period included DCM trials and works, laying of geotextile and
sand blanket, site office establishment, HDD works, and submarine cable
diversion associated works.
The locations of the works areas are presented
in Figure 1.1 to Figure 1.2. Some site
investigation works were carried out during the reporting period.
1.6
Summary of EM&A Programme Requirements
The status for all environmental aspects is
presented in Table
1.3. The EM&A requirements remained unchanged during the
reporting period.
Table 1.3: Summary of Status for All Environmental Aspects under the
Updated EM&A Manual
|
Parameters |
EM&A Requirements |
Status |
|
Air Quality |
|
|
|
Baseline Monitoring |
At least 14 consecutive days before commencement of construction work |
The baseline air quality monitoring result has been reported in Baseline Monitoring Report and submitted to EPD under EP Condition 3.4. |
|
Impact Monitoring |
At least 3 times every 6 days |
On-going |
|
Noise |
|
|
|
Baseline Monitoring |
Daily for a period of at least two weeks prior to the commencement of construction works |
The baseline noise monitoring result has been reported in Baseline Monitoring Report and submitted to EPD under EP Condition 3.4. |
|
Impact Monitoring |
Weekly |
On-going |
|
Water Quality |
|
|
|
General Baseline Water Quality Monitoring for reclamation, water jetting and field joint works |
Three days per week, at mid-flood and mid-ebb tides, for at least four weeks prior to the commencement of marine works. |
The baseline water quality monitoring result has been reported in Baseline Water Quality Monitoring Report and submitted to EPD under EP Condition 3.4. |
|
General Impact Water Quality Monitoring for reclamation, water jetting and field joint works |
Three days per week, at mid-flood and mid-ebb tides. |
On-going |
|
Initial Intensive Deep Cement Mixing (DCM) Water Quality Monitoring |
At least four weeks |
Completed in May 2017. Data analysis in-progress. |
|
Regular DCM Water Quality Monitoring |
Three times per week until completion of DCM works. |
On-going |
|
Waste Management |
|
|
|
Waste Monitoring |
At least weekly |
On-going |
|
Land Contamination |
|
|
|
Supplementary Contamination Assessment Plan (CAP) |
At least 3 months before commencement of any soil remediation works. |
To be submitted with the relevant construction works. |
|
Contamination Assessment Report (CAR) for Golf Course |
CAR to be submitted for golf course first; programme for submission of supplementary CAR at the other areas to be agreed. |
The CAR for Golf Course was submitted to EPD. |
|
Terrestrial Ecology |
|
|
|
Pre-construction Egretry Survey Plan |
Once per month in the breeding season between April and July, prior to the commencement of HDD drilling works. |
The revised Egretry Survey Plan was submitted and approved by EPD under EP Condition 2.14. |
|
Ecological Monitoring |
Monthly monitoring during the HDD construction works period from August to March. |
Construction works on Sheung Sha Chau Island was suspended during the ardeid’s breeding season (between April and July). The ecological monitoring is therefore suspended. |
|
Marine Ecology |
|
|
|
Pre-Construction Phase Coral Dive Survey |
Prior to marine construction works |
The Coral Translocation Plan was submitted and approved by EPD under EP Condition 2.12. |
|
Coral Translocation |
- |
The coral translocation was completed on 5 January 2017. |
|
Post-translocation Monitoring |
As per an enhanced monitoring programme based on the Coral Translocation Plan |
On-going |
|
Chinese White Dolphins (CWD) |
|
|
|
Baseline Monitoring |
6 months of baseline surveys before the commencement of land formation related construction works. Vessel surveys: Two full surveys per month; Land-based theodolite tracking: Two days per month at the Sha Chau station and two days per month at the Lung Kwu Chau Station; and PAM: For the whole duration of baseline period. |
Baseline CWD results were reported in the CWD Baseline Monitoring Report and submitted to EPD in accordance with EP Condition 3.4. |
|
Impact Monitoring |
Vessel surveys: Two full surveys per month; Land-based theodolite tracking: One day per month at the Sha Chau station and one day per month at the Lung Kwu Chau Station; and PAM: For the whole duration for land formation related construction works. |
On-going |
|
Landscape and Visual |
|
|
|
Baseline Monitoring |
One-off survey within the Project site boundary prior to commencement of any construction works |
The baseline landscape & visual monitoring result has been reported in Baseline Monitoring Report and submitted to EPD under EP Condition 3.4. |
|
Impact Monitoring |
Weekly |
On-going |
|
Environmental Auditing |
|
|
|
Regular site inspection |
Weekly |
On-going |
|
Marine Mammal Watching Plan (MMWP) implementation measures |
Monitor and check |
On-going |
|
Dolphin Exclusion Zone Plan (DEZP) implementation measures |
Monitor and check |
On-going |
|
SkyPier High Speed Ferries (HSF) implementation measures |
Monitor and check |
On-going |
|
Construction and Associated Vessels implementation measures |
Monitor and check |
On-going |
|
Complaint Hotline and Email Channel |
Construction phase |
On-going |
|
Environmental Log Book |
Construction phase |
On-going |
Taking into account the construction works
during the reporting period, impact monitoring of air quality, noise, water
quality, waste management, and CWD were carried out in the reporting period. Upon completion of coral translocation in January 2017, a
summary of the ensuing post-translocation monitoring is reported quarterly.
The EM&A programme also involved weekly
site inspections and related auditing conducted by ET for the checking of
implementation of required environmental mitigation measures recommended in the
approved EIA Report. In order to enhance environmental awareness and closely
monitor the environmental performance of the contractors, environmental
briefings and regular environmental management meetings were conducted.
The EM&A programme has
been following the recommendations presented in the approved EIA Report and the
Manual. A summary of implementation status of the environmental mitigation
measures for the construction phase of the Project during the reporting period
is provided in Appendix B.
2
Environmental Monitoring and
Auditing
2.1
Air Quality Monitoring
Impact 1-hour Total Suspended
Particulates (TSP) monitoring was conducted three times every six days at two
representative monitoring stations during the reporting period. The
locations of monitoring stations are described in Table 2.1 and presented in Figure 2.1. The Action and Limit Levels of
the air quality monitoring stipulated in the EM&A programme for triggering
the relevant investigation and follow-up procedures under the programme are
also provided in Table 2.1
for reference.
Table 2.1: Impact Air Quality
Monitoring Stations
|
Monitoring Station |
Location |
Action Level (mg/m3) |
Limit Level (mg/m3) |
|
AR1A |
Man Tung Road Park |
306 |
500 |
|
AR2 |
Village House at Tin Sum |
298 |
The graphical plot of impact air quality
monitoring results during the reporting period is presented in Graph 1.
Graph 1:
Graphical Plot of 1-hour TSP concentration at AR1A and AR2 during the Reporting
Period
Three Limit Level exceedance cases of air
quality monitoring were recorded at AR2 on 10 May 2017 in the 1-hour TSP
monitoring. Actions were taken accordingly based on the established Event and
Action Plan as presented in the Manual. No major construction dust emission
source was observed from the field investigation. It was also confirmed with
the contractors that no major dusty construction works was undertaken when the
exceedances were recorded. Dust suppression measures were properly implemented
by relevant contractors during the monitoring period. Investigation found that
Hong Kong was being affected by an airstream with high background pollutant
concentration and poor atmospheric conditions for pollutant dispersion on the
monitoring day, thus the exceedances were likely due to the adverse ambient air
quality, but not due to Project activities.
The weather varied from sunny to rainy during
the reporting period. Wind direction was mainly south or southwest in the
reporting period.
The key activities of the Project carried out
in the reporting period are summarised in Section 1.5. Those works were not likely to
cause adverse dust pollution.
The active construction site is around 3 km
away from the nearest air sensitive receiver in Tung Chung. The major dust
sources during the reporting period were observed to be local air pollution and
nearby traffic emissions. It is considered that the monitoring work in the
reporting period was effective and there was no adverse impact attributable to
the works of the Project.
2.2
Noise Monitoring
Impact
noise monitoring was conducted at five representative monitoring stations once
per week during 0700 and 1900 during the reporting period. The locations of
monitoring stations are described in Table 2.2 and presented in Figure 2.1. The Action and Limit Levels of
the noise monitoring stipulated in the EM&A programme for triggering the
relevant investigation and follow-up procedures under the programme are
provided in Table 2.2 for reference.
The graphical plot of impact noise quality
monitoring results during the reporting period is presented in Graph 2.
Table 2.2: Impact Noise Quality Monitoring
Stations
|
Monitoring Station |
Location |
Action Level |
Limit Level |
|
NM1A |
Man Tung Road Park |
When one documented complaint is received from any one of the sensitive receivers |
75 dB(A) |
|
NM3A |
Site Office |
75 dB(A) |
|
|
NM4(i) |
Ching Chung Hau Po Woon Primary School |
65dB(A) / 70 dB(A) |
|
|
NM5 |
Village House in Tin Sum |
75 dB(A) |
|
|
NM6 |
House No. 1, Sha Lo Wan |
75 dB(A) |
|
|
Note: (i) Reduced to 70dB(A) for school and 65dB(A) during school examination periods. |
|||
Graph 2:
Graphical Plot of Leq (30min) at NM1A, NM3A, NM4, NM5 and NM6 during
the Reporting Period
Note: School examination took place
from 5 to 9 June 2017 in the reporting period.
No exceedance of the Action and Limit Level was
recorded at all monitoring stations in the reporting period.
The key activities of the Project carried out
in the reporting period are summarised in Section 1.5. Those works were not likely to
cause adverse noise impact.
The active construction work is
around 900 m away from the nearest noise sensitive receivers in the villages in
North Lantau. The major noise sources during the
reporting period were observed to be road traffic at NM1A, aircrafts and
helicopters at NM3A, school activities at NM4, helicopters at NM5, and
aircrafts, helicopters, and marine vessels at NM6. It
is considered that the monitoring work in the reporting period was effective
and there was no adverse impact attributable to the works of the Project.
2.3
Water Quality Monitoring
During the reporting period, water quality
monitoring was conducted at a total of 23 water quality monitoring stations,
comprising 12 impact (IM) stations, one mobile IM station, seven sensitive receiver
(SR) stations, and three control stations in the vicinity of the water quality
sensitive receivers around the airport island in accordance with the Manual.
The purpose of water quality monitoring at the IM stations is to promptly
capture any potential water quality impacts from the Project before the impacts
could become apparent at sensitive receivers (represented by the SR stations). Table 2.3 describes
the details of the monitoring stations. Figure 2.2 shows the locations of the
monitoring stations.
Table
2.3: Monitoring Locations and Parameters for Impact Water Quality Monitoring
|
Monitoring Stations |
Description |
Coordinates |
Parameters |
|
|
|
|
Easting |
Northing |
|
|
C1 |
Control |
804247 |
815620 |
|
|
C2 |
Control |
806945 |
825682 |
|
|
C3(3) |
Control |
817803 |
822109 |
|
|
IM1 |
Impact |
806458 |
818351 |
DO, pH, Temperature, Salinity, Turbidity, SS, Total Alkalinity, Heavy Metals(2) |
|
IM2 |
Impact |
806193 |
818852 |
|
|
IM3 |
Impact |
806019 |
819411 |
|
|
IM4 |
Impact |
805039 |
819570 |
|
|
IM5 |
Impact |
804924 |
820564 |
|
|
IM6 |
Impact |
805828 |
821060 |
|
|
IM7 |
Impact |
806835 |
821349 |
|
|
IM8 |
Impact |
807838 |
821695 |
|
|
IM9 |
Impact |
808811 |
822094 |
|
|
IM10 |
Impact |
809838 |
822240 |
|
|
IM11 |
Impact |
810545 |
821501 |
|
|
IM12 |
Impact |
811519 |
821162 |
|
|
IM13 |
Impact (for submarine 11 kV cable diversion) |
Mobile station (500 m envelope of water jetting works) |
DO, pH, Temperature, Salinity, Turbidity, SS |
|
|
SR1(1) |
Future Hong Kong-Zhuhai-Macao Bridge Hong Kong Boundary Crossing Facilities (HKBCF) Seawater Intake for cooling |
812586 |
820069 |
DO, pH, Temperature, Salinity, Turbidity, SS
|
|
SR2(3) |
Planned marine park / hard corals at The Brothers / Tai Mo To |
814166 |
821463 |
|
|
SR3 |
Sha Chau and Lung Kwu Chau Marine Park / fishing and spawning grounds in North Lantau |
807571 |
822147 |
|
|
SR4A |
Sha Lo Wan |
807810 |
817189 |
|
|
SR5A |
San Tau Beach SSSI |
810696 |
816593 |
|
|
SR6 |
Tai Ho Bay, Near Tai Ho Stream SSSI |
814663 |
817899 |
|
|
SR7 |
Ma Wan Fish Culture Zone (FCZ) |
823742 |
823636 |
|
|
SR8 |
Seawater Intake for cooling at Hong Kong International Airport (East) |
811593 |
820417 |
|
(1) The seawater intakes of SR1 for
the future HKBCF are not yet in operation, hence no water quality impact
monitoring was conducted at this station. The future permanent location for SR1
during impact monitoring is subject to finalisation after the HKBCF seawater
intake is commissioned.
(2) Details of
selection criteria for the two heavy metals for regular DCM monitoring refer to
the Detailed Plan on Deep Cement Mixing available on the dedicated 3RS website
(http://env.threerunwaysystem.com/en/ep-submissions.html). DCM specific water quality monitoring parameters (total alkalinity
and heavy metals) were only conducted at C1 to C3, SR2, and IM1 to IM12.
(3) According
to the baseline water quality monitoring report, C3 station is not adequately
representative as a control station of IM / SR stations during the flood tide.
The control reference has been changed from C3 to SR2 from 1 September 2016
onwards.
2.3.1 Monitoring Schedule
During the reporting period, general water
quality monitoring and regular DCM water quality monitoring were conducted
three days per week, at mid-flood and mid-ebb tides, at the 23 water quality
monitoring stations.
As confirmed by Contract 3212, the 11kV
submarine cable diversion and associated works were conducted in the period of
1 to 10 April, 14 to 17 April, 8 to 19 May, and 21 to 23 May 2017. The cable
diversion and associated works were substantially completed on 23 May 2017.
Therefore, general water quality monitoring was conducted at the mobile impact
station of IM13 at mid-flood and mid-ebb tides during the construction period
and ceased after 23 May 2017.
2.3.2 Action and Limit Levels for Water Quality Monitoring
The Action and Limit Levels for general water
quality monitoring and regular DCM monitoring stipulated in the EM&A
programme for triggering the relevant investigation and follow-up procedures
under the programme are presented in Table 2.4. The control and IM stations during flood tide
and ebb tide for general water quality monitoring and regular DCM monitoring
are presented in Table 2.5.
Table 2.4: Action and Limit Levels
for General Water Quality Monitoring and Regular DCM Monitoring
|
Parameters |
Action Level (AL) |
Limit Level (LL) |
||
|
Action and Limit Levels for general water quality monitoring and regular DCM monitoring (excluding SR1& SR8) |
||||
|
DO in mg/L (Surface, Middle & Bottom) |
Surface and Middle 4.5 mg/L |
Surface and Middle 4.1 mg/L 5 mg/L for Fish Culture Zone (SR7) only |
||
|
Bottom 3.4 mg/L |
Bottom 2.7 mg/L |
|||
|
Suspended Solids (SS) in mg/L |
23 |
or 120% of upstream control station at the same tide of the same day, whichever is higher |
37 |
or 130% of upstream control station at the same tide of the same day, whichever is higher |
|
Turbidity in NTU |
22.6 |
36.1 |
||
|
Total Alkalinity in ppm |
95 |
99 |
||
|
Representative Heavy Metals for early regular DCM monitoring (Chromium) |
0.2 |
0.2 |
||
|
Representative Heavy Metals for early regular DCM monitoring (Nickel) |
3.2 |
|
3.6 |
|
|
Action and Limit Levels SR1 |
|
|
|
|
|
SS (mg/l) |
To be determined prior to its commissioning |
To be determined prior to its commissioning |
||
|
Action and Limit Levels SR8 |
|
|
|
|
|
SS (mg/l) |
52 |
|
60 |
|
Notes:
1. For DO measurement, non-compliance occurs when monitoring result is
lower than the limits.
2. For parameters other than DO, non-compliance of water quality results when
monitoring results is higher than the limits.
3. Depth-averaged results are used unless specified otherwise.
4. Details of selection criteria for the two heavy metals for early regular
DCM monitoring refer to the Detailed Plan on Deep Cement Mixing available on
the dedicated 3RS website http://env.threerunwaysystem.com/en/ep-submissions.html)
5. The Action and Limit Levels for the two representative heavy metals chosen
will be the same as that for the intensive DCM monitoring.
Table 2.5: The Control and Impact Stations
during Flood Tide and Ebb Tide for General Water Quality Monitoring and Regular
DCM Monitoring
|
Control Station |
Impact Stations |
|
Flood Tide |
|
|
C1 |
IM1, IM2, IM3, IM4, IM5, IM6, IM7, IM8, IM13, SR3 |
|
SR2^1 |
IM7, IM8, IM9, IM10, IM11, IM12, SR1A, SR3, SR4A, SR5A, SR6, SR8 |
|
Ebb Tide |
|
|
C1 |
SR4A, SR5A, SR6 |
|
C2 |
IM1, IM2, IM3, IM4, IM5, IM6, IM7, IM8, IM9, IM10, IM11, IM12, IM13, SR1A, SR2, SR3, SR7, SR8 |
^1 As per findings of Baseline Water
Quality Monitoring Report, the control reference has been changed from C3 to
SR2 from 1 Sep 2016 onwards.
2.3.3
Summary of Monitoring Results
The monitoring results for total alkalinity
obtained during the reporting period did not exceed their corresponding Action
and Limit Levels stipulated in the EM&A programme for triggering the
relevant investigation and follow-up procedures under the programme if being
exceeded. For DO, turbidity, suspended solids (SS), chromium, and nickel, some
of the testing results exceeded the relevant Action or Limit Levels in the
reporting period, and the corresponding investigations were conducted
accordingly. The investigation findings concluded that the exceedances were not
due to the Project. Summaries of DO, turbidity, SS, chromium, and nickel
compliance status are presented in Table 2.6 to Table 2.15.
Findings
for DO Exceedances
Table 2.6, Table 2.7 and Table 2.8 present a
summary of the DO compliance status at IM and SR stations during mid-ebb and
mid flood tide for the reporting period.
Table 2.6:
Summary of DO (Surface and Middle) Compliance Status (Mid-Ebb Tide)
|
IM1 |
IM2 |
IM3 |
IM4 |
IM5 |
IM6 |
IM7 |
IM8 |
IM9 |
IM10 |
IM11 |
IM12 |
SR2 |
SR3 |
SR4A |
SR5A |
SR6 |
SR7 |
|
|
20/06/2017 |
|
|
|
|
|
|
|
|
|
|
|
|
|
|
|
|
|
|
|
22/06/2017 |
|
|
|
|
|
|
|
|
|
|
|
|
|
|
|
|
|
|
|
24/06/2017 |
|
|
|
|
|
|
|
|
|
|
|
|
|
|
|
|
|
|
|
No. of Exceedance |
3 |
1 |
1 |
1 |
1 |
2 |
2 |
1 |
1 |
0 |
2 |
1 |
0 |
3 |
2 |
0 |
0 |
3 |
Table 2.7:
Summary of DO (Bottom) Compliance Status (Mid-Ebb Tide)
|
IM1 |
IM2 |
IM3 |
IM4 |
IM5 |
IM6 |
IM7 |
IM8 |
IM9 |
IM10 |
IM11 |
IM12 |
SR2 |
SR3 |
SR4A |
SR5A |
SR6 |
SR7 |
|
|
20/06/2017 |
|
|
|
|
|
|
|
|
|
|
|
|
|
|
|
|
|
|
|
22/06/2017 |
|
|
|
|
|
|
|
|
|
|
|
|
|
|
|
|
|
|
|
No. of Exceedance |
0 |
1 |
2 |
0 |
1 |
1 |
0 |
1 |
0 |
2 |
0 |
1 |
0 |
1 |
1 |
0 |
0 |
1 |
Table 2.8:
Summary of DO (Surface and Middle) Compliance Status (Mid-Flood Tide)
|
IM1 |
IM2 |
IM3 |
IM4 |
IM5 |
IM6 |
IM7 |
IM8 |
IM9 |
IM10 |
IM11 |
IM12 |
SR2 |
SR3 |
SR4A |
SR5A |
SR6 |
SR7 |
|
|
20/06/2017 |
|
|
|
|
|
|
|
|
|
|
|
|
|
|
|
|
|
|
|
22/06/2017 |
|
|
|
|
|
|
|
|
|
|
|
|
|
|
|
|
|
|
|
24/06/2017 |
|
|
|
|
|
|
|
|
|
|
|
|
|
|
|
|
|
|
|
No. of Exceedance |
0 |
1 |
0 |
0 |
0 |
1 |
2 |
3 |
2 |
1 |
2 |
1 |
0 |
3 |
0 |
0 |
0 |
3 |
Note: The monitoring results on monitoring dates not
presented in the above tables did not exceed their corresponding Action or
Limit Levels. Detailed results are presented in Appendix C.
|
Legend: |
|
|
|
No exceedance of Action and Limit Level |
|
|
Exceedance of Action Level recorded at monitoring station located downstream of the Project based on dominant tidal flow |
|
|
Exceedance of Action Level recorded at monitoring station located upstream of the Project based on dominant tidal flow |
|
|
Exceedance of Limit Level recorded at monitoring station located downstream of the Project based on dominant tidal flow |
|
|
Exceedance of Limit Level recorded at monitoring station located upstream of the Project based on dominant tidal flow |
|
|
Upstream station with respect to the Project during the respective tide based on dominant tidal flow |
Investigations were conducted for each of the
exceedances and details of the investigation findings are presented in the
Construction Phase Monthly EM&A Report no. 18. All
exceedances were found not due to the Project.
The monitoring results, including results from
repeat measurements, showed that DO (Surface and Middle) and DO (Bottom)
results at the control stations as well as some upstream impact stations were
low (and mostly below Action or Limit Level) from 20 to 25 June 2017. This
indicates that low DO was occurring over a larger area including areas well
outside the influence of the Project’s activities, which suggests the
likelihood of sources and/or causes originating outside of the Project
boundaries. Besides, the DO pattern as shown in Appendix C which shows a widespread decline
in DO levels across all monitoring stations from 15 June 2017 onwards appears
to be a result of the aftermath of a severe weather condition (i.e. Severe
Tropical Storm Merbok followed by a period of continuous rainfall) in Hong Kong
between 12 and 21 June 2017.
Separately, investigations were carried out and
confirmed that both DCM and sand blanket laying activities were operating
normally with silt curtains deployed as additional measures. No construction
vessel nor silt plume was observed in the vicinity of
the monitoring stations when exceedances were recorded.
Combining the monitoring results during ebb and
flood tides from 15 June 2017 onwards, as well as the observations during water
quality monitoring, it is concluded that the patterns of exceedances indicate a
macro-scale event affecting the DO concentration in the north Lantau water,
rather than local sources. Therefore, the exceedances were considered not due
to the Project.
Findings for Turbidity Exceedances
Table
2.9 presents a summary of the turbidity compliance status at IM
and SR stations during mid-ebb tide for the reporting period.
Table 2.9:
Summary of Turbidity Compliance Status (Mid-Ebb Tide)
|
IM1 |
IM2 |
IM3 |
IM4 |
IM5 |
IM6 |
IM7 |
IM8 |
IM9 |
IM10 |
IM11 |
IM12 |
SR2 |
SR3 |
SR4A |
SR5A |
SR6 |
SR7 |
|
|
24/06/2017 |
|
|
|
|
|
|
|
|
|
|
|
|
|
|
|
|
|
|
|
No. of Exceedance |
0 |
0 |
0 |
0 |
0 |
0 |
0 |
0 |
0 |
0 |
0 |
0 |
0 |
1 |
0 |
0 |
0 |
0 |
Note: The monitoring results on monitoring dates not
presented in the above table did not exceed their corresponding Action or Limit
Levels. Detailed results are presented in Appendix C.
|
Legend: |
|
|
|
No exceedance of Action and Limit Level |
|
|
Exceedance of Action Level recorded at monitoring station located downstream of the Project based on dominant tidal flow |
|
|
Exceedance of Action Level recorded at monitoring station located upstream of the Project based on dominant tidal flow |
|
|
Upstream station with respect to the Project during the respective tide based on dominant tidal flow |
Investigation was
conducted for the exceedance and details of the investigation findings are
presented in the Construction Phase Monthly EM&A Report
no. 18. The exceedance was found not due to the Project.
The Action Level
exceedance occurred at a monitoring station which was located upstream of the
Project during ebb tide, which would unlikely be affected by the Project.
Therefore, the exceedance was considered not due to the Project.
Findings for SS Exceedances
Table
2.10 and Table
2.11 present a summary of the SS compliance status at IM and SR
stations during mid-ebb and mid-flood tide for the reporting period.
Table 2.10:
Summary of SS Compliance Status (Mid-Ebb Tide)
|
IM1 |
IM2 |
IM3 |
IM4 |
IM5 |
IM6 |
IM7 |
IM8 |
IM9 |
IM10 |
IM11 |
IM12 |
IM13 |
SR2 |
SR3 |
SR4A |
SR5A |
SR6 |
SR7 |
SR8 |
|
|
01/04/2017 |
|
|
|
|
|
|
|
|
|
|
|
|
|
|
|
|
|
|
|
|
|
No. of Exceedance |
0 |
0 |
0 |
0 |
0 |
0 |
0 |
0 |
0 |
0 |
0 |
0 |
0 |
1 |
0 |
0 |
0 |
0 |
0 |
0 |
Table 2.11:
Summary of SS Compliance Status (Mid-Flood Tide)
|
IM1 |
IM2 |
IM3 |
IM4 |
IM5 |
IM6 |
IM7 |
IM8 |
IM9 |
IM10 |
IM11 |
IM12 |
IM13 |
SR2 |
SR3 |
SR4A |
SR5A |
SR6 |
SR7 |
SR8 |
|
|
01/04/2017 |
|
|
|
|
|
|
|
|
|
|
|
|
|
|
|
|
|
|
|
|
|
29/04/2017 |
|
|
|
|
|
|
|
|
|
|
|
|
|
|
|
|
|
|
|
|
|
No. of Exceedance |
0 |
0 |
0 |
2 |
0 |
1 |
0 |
0 |
0 |
0 |
0 |
0 |
0 |
0 |
0 |
1 |
0 |
1 |
0 |
0 |
Note: The monitoring results on monitoring dates not
presented in the above table did not exceed their corresponding Action or Limit
Levels. Detailed results are presented in Appendix C.
|
Legend: |
|
|
|
No exceedance of Action and Limit Level |
|
|
Exceedance of Action Level recorded at monitoring station located downstream of the Project based on dominant tidal flow |
|
|
Exceedance of Action Level recorded at monitoring station located upstream of the Project based on dominant tidal flow |
|
|
Upstream station with respect to the Project during the respective tide based on dominant tidal flow |
|
|
No water quality monitoring conducted at IM13 when Contract 3212 had no water jetting works |
Investigations were
conducted for each of the exceedances and details of the investigation findings
are presented in the Construction Phase monthly EM&A
Report no. 16. All exceedances were found not due to the Project.
Some exceedances
occurred at monitoring stations which were located upstream of the Project. As
such upstream stations would unlikely be affected by the Project, the
investigation focused on the exceedances at stations located downstream of the
Project and hence might be affected by the Project’s activities.
For the exceedance at
SR2 on 1 April 2017 during mid-ebb tide, no exceedance was recorded at all
downstream IM stations which were located closer to the active works by the
Project. Therefore, the exceedance was unlikely to be affected by the Project.
For the exceedance at
IM6 on 29 April 2017 during mid-flood tide, it appeared to be an isolated case
with neither temporal nor spatial trend to indicate any effect due to Project
activities. Taking into account the investigation findings, the details of
which are reported in the Construction Phase Monthly EM&A
Report no. 16, the exceedance was considered not due to the Project.
Findings
for Chromium Exceedances
Table 2.12 and Table 2.13 present a summary of the chromium
compliance status at IM stations during mid-ebb and mid-flood tide for the
reporting period.
Table 2.12:
Summary of Chromium Compliance Status (Mid-Ebb Tide)
|
IM1 |
IM2 |
IM3 |
IM4 |
IM5 |
IM6 |
IM7 |
IM8 |
IM9 |
IM10 |
IM11 |
IM12 |
|
|
04/06/2017 |
|
|
|
|
|
|
|
|
|
|
|
|
|
No. of Exceedance |
0 |
0 |
0 |
0 |
0 |
0 |
1 |
0 |
0 |
0 |
0 |
0 |
Table 2.13:
Summary of Chromium Compliance Status (Mid-Flood Tide)
|
IM1 |
IM2 |
IM3 |
IM4 |
IM5 |
IM6 |
IM7 |
IM8 |
IM9 |
IM10 |
IM11 |
IM12 |
|
|
01/04/2017 |
|
|
|
|
|
|
|
|
|
|
|
|
|
No. of Exceedance |
0 |
0 |
0 |
0 |
0 |
0 |
1 |
0 |
0 |
0 |
0 |
0 |
Note: The monitoring results on monitoring dates not
presented in the above table did not exceed their corresponding Action or Limit
Levels. Detailed results are presented in Appendix C.
|
Legend: |
|
|
|
No exceedance of Action and Limit Level |
|
|
Exceedance of Action Level recorded at monitoring station located downstream of the Project based on dominant tidal flow |
|
|
Exceedance of Action Level recorded at monitoring station located upstream of the Project based on dominant tidal flow |
|
|
Upstream station with respect to the Project during the respective tide based on dominant tidal flow |
Investigations were conducted for
each of the exceedances and details of the investigation findings are presented
in the Construction Phase Monthly EM&A Report no.
16 and 18. All exceedances were found not due to the Project
For the exceedance at IM7 during
mid-ebb tide on 4 June 2017, as the exceedance occurred at a monitoring station
located upstream during ebb tide, it was considered not due to the Project.
For the exceedance at IM7 during
mid-flood tide on 1 April 2017, it appeared to be an isolated case with no
observable temporal and spatial trend to indicate any effect due to Project
activities. Furthermore, no exceedance was recorded at other downstream
monitoring station located closer to active DCM works during the same
monitoring period. Based on these findings, the exceedance was considered not
due to the Project.
Findings for Nickel Exceedances
Table 2.14 and Table 2.15 presents a
summary of the nickel compliance status at IM stations during mid-ebb and
mid-flood tide for the reporting period.
Table 2.14:
Summary of Nickel Compliance Status (Mid-Ebb Tide)
|
IM1 |
IM2 |
IM3 |
IM4 |
IM5 |
IM6 |
IM7 |
IM8 |
IM9 |
IM10 |
IM11 |
IM12 |
|
|
23/05/2017 |
|
|
|
|
|
|
|
|
|
|
|
|
|
No. of Exceedance |
0 |
0 |
0 |
0 |
0 |
0 |
0 |
0 |
0 |
1 |
0 |
0 |
Table 2.15: Summary of Nickel Compliance Status (Mid-Flood Tide)
|
IM1 |
IM2 |
IM3 |
IM4 |
IM5 |
IM6 |
IM7 |
IM8 |
IM9 |
IM10 |
IM11 |
IM12 |
|
|
04/04/2017 |
|
|
|
|
|
|
|
|
|
|
|
|
|
08/04/2017 |
|
|
|
|
|
|
|
|
|
|
|
|
|
09/05/2017 |
|
|
|
|
|
|
|
|
|
|
|
|
|
18/05/2017 |
|
|
|
|
|
|
|
|
|
|
|
|
|
25/05/2017 |
|
|
|
|
|
|
|
|
|
|
|
|
|
20/06/2017 |
|
|
|
|
|
|
|
|
|
|
|
|
|
24/06/2017 |
|
|
|
|
|
|
|
|
|
|
|
|
|
No. of Exceedance |
0 |
0 |
0 |
0 |
0 |
1 |
3 |
3 |
4 |
2 |
1 |
1 |
Note: The
monitoring results on monitoring dates not presented in the above table did not
exceed their corresponding Action or Limit Levels. Detailed results are
presented in Appendix C.
|
Legend: |
|
|
|
No exceedance of Action and Limit Level |
|
|
Exceedance of Action Level recorded at monitoring station located downstream of the Project based on dominant tidal flow |
|
|
Exceedance of Action Level recorded at monitoring station located upstream of the Project based on dominant tidal flow |
|
|
Exceedance of Limit Level recorded at monitoring station located downstream of the Project based on dominant tidal flow |
|
|
Exceedance of Limit Level recorded at monitoring station located upstream of the Project based on dominant tidal flow |
|
|
Upstream station with respect to the Project during the respective tide based on dominant tidal flow |
Investigations were conducted for each of the
exceedances and details of the investigation findings are presented in the
Construction Phase Monthly EM&A Report no. 16, 17, and 18. All exceedances
were found not due to the Project.
For the exceedance at IM10 during mid-ebb tide
on 23 May 2017, as the exceedance occurred at a monitoring station located
upstream during ebb tide, it was considered not due to the Project.
For the exceedance events during mid-flood
tide, it was observed that overall these occurred dis-continuously (i.e. no
repeated exceedances during consecutive monitoring days), while some of the
exceedances (those recorded on 4 and 8 April, 18 and 25 May, and 24 June 2017)
were also isolated (singular) cases with no observable trend to indicate any
effect due to Project activities.
For the exceedances recorded on 9 May and 20
June 2017, it is noted that no SS exceedance was recorded during the same
monitoring period. As nickel is a representative heavy metal that indicates the
potential for release of contaminants from contaminated mud pits due to the
disturbance of marine sediment in contaminated mud pits by DCM activities, the
low SS levels indicate that the active DCM works had limited or insignificant
effect on downstream water quality. In addition, some of the exceedance events
occurred at upstream stations in the reporting period, which might indicate
potential nickel source originating from areas outside of the project boundary.
Nevertheless, all exceedances were investigated
and taking into account the investigation findings, the details of which are
reported in the Construction Phase Monthly EM&A Report nos. 16, 17 and 18,
the exceedances were considered not due to the Project.
Conclusions
Based on the findings of the exceedance
investigations presented in Construction Phase Monthly EM&A
Report no. 16, 17, and 18, it was concluded that the exceedances during this
reporting period were not due to the Project; hence, no SR stations were
adversely affected by the Project. All required actions under the Event and
Action Plan had been followed. Exceedances appeared due to natural fluctuation
or other sources not related to the Project.
Nevertheless, recognising that the IM stations
represent a ‘first line of defence’, the non-project related exceedances
identified at IM stations have been attended to as triggers of precautionary
measures. As part of the EM&A programme, the construction methods and
mitigation measures for water quality will continue to monitor and
opportunities for further enhancement will continue to explored and implement
where possible, to strive for better protection of water quality and the marine
environment.
In the meantime, the contractors were reminded
to implement and maintain all mitigation measures during weekly site
inspection. These include maintaining the silt curtain for sand blanket laying properly and maintaining the levels of materials on
barges to avoid overflow as recommended in the Manual.
2.4 Waste Monitoring
In accordance with the Manual, the waste
generated from construction activities was audited once per week to determine
if wastes were being managed in accordance with the Waste Management Plan (WMP)
prepared for the Project, contract-specific WMP, and any statutory and
contractual requirements. All aspects of waste management including waste
generation, storage, transportation, and disposal were assessed during the
audits. The Action and Limit Levels of the construction waste are provided in Table 2.16.
Table 2.16: Action and Limit Levels for Construction Waste
|
Monitoring Stations |
Action Level |
Limit Level |
|
Construction Area |
When one valid documented complaint is received |
Non-compliance of the WMP, contract-specific WMPs, any statutory and contractual requirements |
Weekly waste monitoring of the Project
construction works was carried out by the ET to check and monitor the
implementation of proper waste management practices during the construction
phase during the reporting period.
Recommendations were provided during
monitoring, including provision and maintenance of spill kits and drip trays,
and provision of proper storage area for general refuse, chemical and chemical
waste. In addition, relevant contractors were reminded to provide recycling
bins for the segregation of recyclables from general refuse. The contractors
had taken actions to implement the recommended measures.
Based on the contractor’s information, about
2,203 m3 of excavated materials were produced from the HDD launching
site under P560(R) during the reporting period. The generated excavated
materials were temporarily stored at the stockpiling area. The excavated
material will be reused in the Project.
In addition, metal and paper were recycled
during the reporting period. Around 292 tonnes of
general refuse was disposed of to the West New Territories (WENT) Landfill by
the advance works contract and DCM contracts, 0.08 tonnes and 1,600 litres of
chemical waste were collected by licensed chemical waste collector. Around
1,281 m3 of Construction and Demolition (C&D) material generated from the
DCM contracts was disposed of as public fill in the reporting period.
No exceedance of the Action or Limit Levels was
recorded in the reporting period.
2.5 CWD Monitoring
2.5.1 Summary of Monitoring Requirements
CWD monitoring was conducted by vessel
line-transect survey at a frequency of two full survey
per month, supplemented by land-based theodolite tracking and Passive Acoustic
Monitoring (PAM). The frequency of the theodolite tracking during the construction
phase was one day per month at both Sha Chau (SC) and Lung Kwu Chau (LKC)
stations as stipulated in the Manual requirement. Additional theodolite
tracking at SC station and LKC station (in total 2 tracking days and 3 tracking
days per month at respective stations) were also conducted on a voluntary basis
to collect supplementary information for the project. Monitoring was fully
completed in the reporting period. The vessel survey transect lines were in
line with those proposed in the Manual, which are consistent with the
Agriculture, Fisheries and Conservation Department (AFCD) long-term monitoring
programme. The locations of CWD monitoring by vessel survey transect conducted
from April to June 2017 are shown in Figure 2.3, whilst the land-based survey
stations are described in Table
2.17 and depicted in Figure 2.4. Location of Passive Acoustic
Monitoring is shown in Figure 2.10.
Table 2.17: Land-based Survey
Station Details
|
Stations |
Location |
Geographical Coordinates |
Station Height (m) |
Approximate Tracking Distance (km) |
|
D |
Sha Chau (SC) |
22° 20’ 43.5” N 113° 53’ 24.66” E |
45.66 |
2 |
|
E |
Lung Kwu Chau (LKC) |
22° 22’ 44.83” N 113° 53’ 0.2” E |
70.40 |
3 |
The Action Level (AL) and Limit Level (LL) for
CWD monitoring were formulated by an action response approach using the running
quarterly dolphin encounter rates (STG and ANI) derived from baseline
monitoring data, as presented in the CWD Baseline Monitoring Report. The
derived values of AL and LL for CWD monitoring are shown in Table 2.18.
Table
2.18: Derived Values of Action Level (AL) and Limit Level (LL) for Chinese White Dolphin Monitoring
|
|
NEL, NWL, AW, WL and SWL as a Whole |
|
Action Level |
Running quarterly STG < 1.86 & ANI < 9.35 |
|
Limit Level |
Two consecutive running quarterly (3-month) STG < 1.86 & ANI < 9.35 |
2.5.2
Summary of
Monitoring Results
Vessel Line-transect Survey
Survey
Effort
During the reporting period, six
complete sets of vessel line-transect surveys were conducted from April to June
2017 to cover all transects in Northeast Lantau (NEL), Northwest Lantau (NWL), Airport West (AW), West
Lantau (WL) and Southwest Lantau (SWL) survey area twice per month.
A total of around 1,344 km of
survey effort was collected from these surveys, with around 88.6% of the total
survey effort being conducted under favourable weather condition (i.e. Beaufort
Sea State 3 or below with favourable visibility). Details of the survey effort
data were presented in Appendix D.
CWD
Sighting
From April to June 2017, there
were total 58 groups of CWDs with 226 individuals sighted (Table 2.19). Amongst
the sightings of CWDs, 53 groups with 210 individuals were made during
on-effort search under favourable weather condition.
When breaking down the sightings
by survey areas, 5 sightings with 10 individuals, 30 sightings with 153
individuals and 23 sightings with 63 individuals were recorded in NWL, WL and
SWL respectively during the current reporting period. No CWD was sighted in NEL
and AW survey areas. Compared to both last quarter (i.e. January to March 2017)
and the same quarter in year 2016 (i.e. April to June 2016), there was an
observable increase in CWD records in SWL. Table 2.19
below shows the comparison of the numbers of sightings and
individuals between the current reporting period, last quarter and the same
quarter of year 2016.
Table 2.19: Summary of Number of CWD Sightings and Number of CWD
Individuals for Previous Quarters and Current Reporting Period
|
|
Apr to Jun 2016 |
Jan to Mar 2017 |
Apr to Jun 2017 |
|
NEL |
0 (0) |
0 (0) |
0 (0) |
|
NWL |
4 (20) |
5 (16) |
5 (10) |
|
AW |
0 (0) |
2 (5) |
0 (0) |
|
WL |
30 (123) |
33 (126) |
30 (153) |
|
SWL |
12 (42) |
14 (38) |
23 (63) |
|
Total |
46 (185) |
54 (185) |
58 (226) |
Note: Values in ( ) represent number of CWD individuals
Distribution of CWD sightings
recorded from April to June 2017 are illustrated in Figure 2.5.
In NWL, CWD sightings were mainly recorded near the coastal waters northwestern
off Lung Kwu Chau and also the waters between Lung Kwu Chau and Black Point
(Lan Kok Tsui). In WL survey area, CWD sightings were distributed in coastal
waters from Tai O to Fan Lau and also off-shore waters from Tai O to Peaked
Hill. In SWL waters, CWDs sighting locations ranged from Fan Lau to Tong Fuk
particularly the waters around Fan Lau Tung Wan and also the waters between
Soko Islands and Lantau. Details of the sighting data were presented in Appendix D.
Figure 2.5: Sightings Distribution of Chinese White
Dolphins
|
|
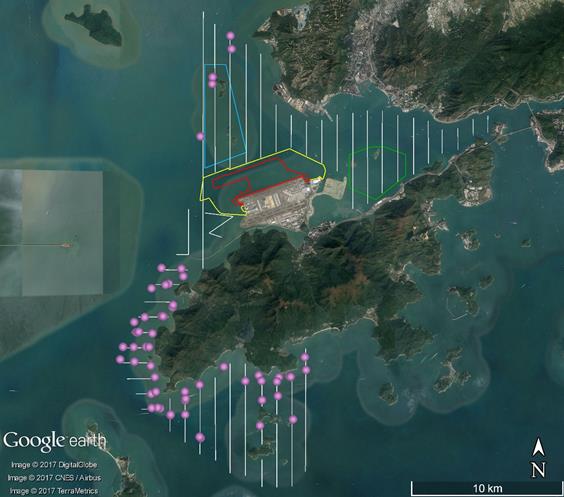
[Pink circle: Sighting locations of CWD, White line: Vessel
survey transects, Blue polygon: Sha Chau and Lung Kwu Chau Marine Park
(SCLKCMP), Green polygon: Brothers Marine Park (BMP), Red polygon: 3RS
land-formation footprint, Yellow line: 3RS temporary works area boundary]
Encounter Rate
The dolphin encounter rates for
the number of dolphin sightings per 100 km survey effort (STG) and for the
total number of dolphins per 100 km survey effort (ANI) in the whole survey
area (i.e. NEL, NWL, AW, WL and SWL) for April, May and June 2017 are
summarized in Table 2.20.
In this reporting period, the
monthly encounter rate STG increase from April to June 2017 while the monthly
encounter rate ANI increase from April to May 2017 followed by a decline in
June 2017. Comparing with the previous reporting period, both
the running quarterly STG and ANI increases from 4.02 to 4.45 and from 14.85 to
17.65 respectively.
Table
2.20: Summary of Monthly and Running Quarterly STG and ANI of Chinese White Dolphin for Previous and Current Reporting Periods
|
|
Previous Reporting Period |
Current Reporting Period |
|||||
|
|
Jan 17 |
Feb 17 |
Mar 17 |
Apr 17 |
May 17 |
Jun 17 |
|
|
Monthly STG |
4.41 |
6.08 |
1.99 |
2.96 |
4.21 |
6.30 |
|
|
Monthly ANI |
15.78 |
21.12 |
8.97 |
8.88 |
25.49 |
18.64 |
|
|
Running Quarterly STG |
3.96 |
5.04 |
4.02 |
3.49 |
3.06 |
4.45 |
|
|
Running Quarterly ANI |
13.02 |
17.31 |
14.85 |
12.33 |
14.46 |
17.65 |
|
Notes: For
detailed calculations of encounter rates STG and ANI, please refer to the
Monthly EM&A Reports No. 16, No. 17 and No. 18.
Group Size
Between April and June 2017, the
group size of CWDs ranged from 1 to 13 individuals per group. The average group
size of CWDs was 3.9 individuals per group while that of last quarter was 3.4.
Half of the CWD sightings (i.e. 29 groups) were in medium group size (i.e. 3-9
individuals). There were three CWD sightings with large group size (i.e. 10 or
above individuals) in this reporting period and they were recorded in WL.
In NWL, CWD sightings with small
group size (i.e. 1-2 individuals) dominated in this reporting period. While in
WL, CWD groups with medium group size were dominant. In SWL, more small-sized
CWD groups were recorded. Sighting locations of CWD groups with different group
sizes were depicted in Figure
2.6.
Figure 2.6: Sighting Locations of Chinese White Dolphins with Different Group Sizes
[Pink circle: Sighting locations of
CWD with group size from 1 to 2 individuals, Green circle: Sighting locations
of CWD with group size from 3 to 9 individuals, Red circle: Sighting locations
of CWD with group size of 10 or above, White line: Vessel survey transects,
Blue polygon: Sha Chau and Lung Kwu Chau Marine Park (SCLKCMP), Green polygon:
Brothers Marine Park (BMP), Red polygon: 3RS land-formation footprint, Yellow
line: 3RS temporary works area boundary]
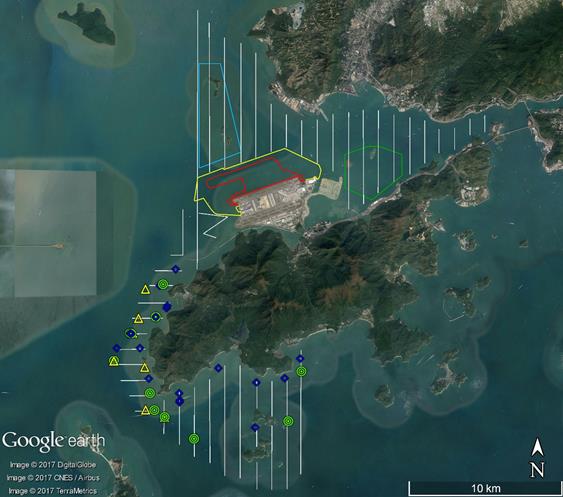
Activities and Association with Fishing Boats
During April to June 2017, 21
groups of CWDs were sighted with feeding activities. Amongst these 21
groups of feeding CWDs, only one group was observed in association with
operating fishing boat (purse seiner) in SWL. The sighting locations of CWDs
engaged in different behaviours during the reporting period were illustrated in
Figure 2.7.
Figure 2.7:
Sighting Locations of Chinese White Dolphins Engaged
in Different Behaviours
[Indigo
rhombus: Foraging, Green circle: Socializing, Pink square:
Milling/Resting, Yellow triangle: Travelling, White line: Vessel survey
transects, Blue polygon: Sha Chau and Lung Kwu Chau Marine Park (SCLKCMP),
Green polygon: Brothers Marine Park (BMP), Red polygon: 3RS land-formation
footprint, Yellow line: 3RS temporary works area boundary]
Mother-calf Pairs
From April to June 2017, 15
sightings of CWDs were recorded with the presence of mother-and-calf,
mother-and-unspotted juvenile and/or mother-and-spotted juvenile pairs. Most of
these mother-calf pairs were sighted in WL. The record in NWL was the
mother-and-spotted juvenile pair (NLMM006 and NLMM013). This pair has not been
re-sighted since December 2016 and was sighted again in June 2017. The sighting
locations of mother-calf pairs were shown in Figure 2.8.
Figure 2.8: Sighting Locations of Mother-calf Pairs
[Pink
circle: Sighting locations of mother-calf pairs, White line: Vessel survey
transects, Blue polygon: Sha Chau and Lung Kwu Chau Marine Park (SCLKCMP),
Green polygon: Brothers Marine Park (BMP), Red polygon: 3RS land-formation
footprint, Yellow line: 3RS temporary works area boundary]
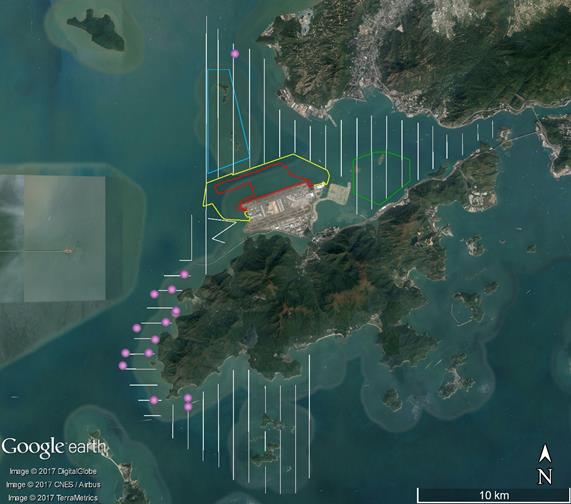
Photo Identification
During April to June 2017, a total number of 67
different CWD individuals were identified altogether 101 times. Re-sighting
information of CWD individuals provides an initial idea of their range use and
apparent connection between different areas around Lantau. Amongst these 67
different CWD individuals, 24 animals (i.e. NLMM004, NLMM016, SLMM011, SLMM014,
SLMM022, SLMM023, SLMM027, SLMM028, SLMM052, WLMM004, WLMM007, WLMM008,
WLMM009, WLMM030, WLMM043, WLMM060, WLMM068, WLMM071, WLMM076, WLMM078,
WLMM079, WLMM082, WLMM084 and WLMM086) were sighted more than once. Nine individuals
including NLMM016, SLMM011, SLMM027, SLMM052, WLMM004, WLMM008, WLMM009,
WLMM076 and WLMM078 were re-sighted in different survey areas within this
reporting period. NLMM016 has cross-area movement in NWL and WL while others
have cross-area movement in WL and SWL. The number of CWD individuals
re-sighted more than once was slighted higher than last quarter (i.e. January
to March 2017) while the number of CWD individuals re-sighted in different
survey areas during the current reporting period remain unchanged compared with
last quarter.
A summary of photo identification
works is presented in Table 2.21.
Representative photos of the 67 identified individuals and figures depicting
the sighting locations of the aforementioned 24 re-sighted individuals recorded
in this reporting period are presented Appendix D.
Table 2.21: Summary of Photo
Identification
|
Individual ID |
Date of sighting |
Sighting Group No. |
Area |
|
Individual ID |
Date of sighting |
Sighting Group No. |
Area |
|
NLMM001 |
11-May-17 |
3 |
WL |
|
WLMM009 |
09-Jun-17 |
4 |
SWL |
|
NLMM004 |
05-Apr-17 |
1 |
NWL |
|
28-Jun-17 |
8 |
WL |
|
|
2 |
NWL |
|
WLMM018 |
11-May-17 |
8 |
WL |
||
|
NLMM006 |
08-Jun-17 |
1 |
NWL |
|
WLMM027 |
22-Jun-17 |
4 |
SWL |
|
NLMM013 |
08-Jun-17 |
1 |
NWL |
|
WLMM030 |
18-Apr-17 |
2 |
WL |
|
NLMM016 |
05-Apr-17 |
1 |
NWL |
|
3 |
WL |
||
|
2 |
NWL |
|
WLMM040 |
09-Jun-17 |
1 |
WL |
||
|
18-Apr-17 |
1 |
WL |
|
WLMM042 |
11-May-17 |
3 |
WL |
|
|
NLMM023 |
11-May-17 |
1 |
WL |
|
WLMM043 |
05-May-17 |
1 |
WL |
|
SLMM007 |
11-May-17 |
9 |
WL |
|
09-Jun-17 |
1 |
WL |
|
|
SLMM010 |
11-May-17 |
10 |
SWL |
|
WLMM052 |
28-Jun-17 |
2 |
WL |
|
SLMM011 |
11-May-17 |
11 |
SWL |
|
WLMM060 |
18-Apr-17 |
2 |
WL |
|
28-Jun-17 |
5 |
WL |
|
3 |
WL |
|||
|
SLMM014 |
22-Jun-17 |
2 |
SWL |
|
WLMM063 |
07-Jun-17 |
2 |
SWL |
|
3 |
SWL |
|
WLMM064 |
26-Apr-17 |
3 |
SWL |
||
|
6 |
SWL |
|
WLMM068 |
18-Apr-17 |
2 |
WL |
||
|
7 |
SWL |
|
3 |
WL |
||||
|
SLMM015 |
04-May-17 |
1 |
SWL |
|
WLMM070 |
11-May-17 |
11 |
SWL |
|
SLMM021 |
26-Apr-17 |
1 |
SWL |
|
WLMM071 |
18-Apr-17 |
2 |
WL |
|
SLMM022 |
05-May-17 |
4 |
WL |
|
3 |
WL |
||
|
5 |
WL |
|
WLMM072 |
18-Apr-17 |
2 |
WL |
||
|
SLMM023 |
05-May-17 |
4 |
WL |
|
WLMM073 |
11-May-17 |
8 |
WL |
|
5 |
WL |
|
WLMM075 |
18-Apr-17 |
2 |
WL |
||
|
11-May-17 |
3 |
WL |
|
WLMM076 |
05-May-17 |
1 |
WL |
|
|
8 |
WL |
|
22-Jun-17 |
1 |
SWL |
|||
|
SLMM027 |
11-May-17 |
3 |
WL |
|
WLMM077 |
05-May-17 |
1 |
WL |
|
8 |
WL |
|
WLMM078 |
05-May-17 |
1 |
WL |
||
|
07-Jun-17 |
2 |
SWL |
|
22-Jun-17 |
1 |
SWL |
||
|
SLMM028 |
18-Apr-17 |
5 |
WL |
|
WLMM079 |
05-May-17 |
4 |
WL |
|
05-May-17 |
5 |
WL |
|
5 |
WL |
|||
|
SLMM031 |
07-Jun-17 |
1 |
SWL |
|
WLMM080 |
11-May-17 |
2 |
WL |
|
SLMM036 |
07-Jun-17 |
3 |
SWL |
|
WLMM081 |
11-May-17 |
2 |
WL |
|
SLMM040 |
22-Jun-17 |
1 |
SWL |
|
WLMM082 |
11-May-17 |
2 |
WL |
|
SLMM047 |
11-May-17 |
8 |
WL |
|
4 |
WL |
||
|
SLMM052 |
05-May-17 |
4 |
WL |
|
WLMM083 |
11-May-17 |
2 |
WL |
|
5 |
WL |
|
WLMM084 |
11-May-17 |
3 |
WL |
||
|
11-May-17 |
10 |
SWL |
|
7 |
WL |
|||
|
07-Jun-17 |
2 |
SWL |
|
WLMM085 |
11-May-17 |
4 |
WL |
|
|
SLMM054 |
18-Apr-17 |
7 |
SWL |
|
WLMM086 |
11-May-17 |
5 |
WL |
|
SLMM055 |
26-Apr-17 |
4 |
SWL |
|
|
09-Jun-17 |
1 |
WL |
|
SLMM056 |
11-May-17 |
11 |
SWL |
|
|
|
3 |
WL |
|
SLMM057 |
22-Jun-17 |
1 |
SWL |
|
WLMM087 |
11-May-17 |
5 |
WL |
|
SLMM058 |
22-Jun-17 |
5 |
SWL |
|
WLMM088 |
11-May-17 |
8 |
WL |
|
WLMM004 |
05-May-17 |
4 |
WL |
|
WLMM089 |
11-May-17 |
8 |
WL |
|
|
5 |
WL |
|
WLMM090 |
09-Jun-17 |
1 |
WL |
|
|
07-Jun-17 |
2 |
SWL |
|
WLMM091 |
28-Jun-17 |
3 |
WL |
|
|
WLMM007 |
05-May-17 |
1 |
WL |
|
WLMM092 |
28-Jun-17 |
3 |
WL |
|
11-May-17 |
6 |
WL |
|
WLMM093 |
28-Jun-17 |
6 |
WL |
|
|
WLMM008 |
11-May-17 |
7 |
WL |
|
WLMM094 |
28-Jun-17 |
6 |
WL |
|
22-Jun-17 |
1 |
SWL |
|
WLMM095 |
28-Jun-17 |
6 |
WL |
|
|
|
|
|
|
WLMM096 |
28-Jun-17 |
8 |
WL |
Land-based Theodolite Tracking
Survey Effort
During April to June 2017, a
total of 15 days of land-based theodolite tracking survey effort were
completed, including nine days on Lung Kwu Chau and six days on Sha Chau. In
total, 17 CWD groups were tracked from the Lung Kwu Chau station, with 0.19 CWD
groups sighted per survey effort hour. No CWDs were sighted from the Sha Chau
station during the current reporting period.
Information on survey effort and
CWD groups sighted during land-based theodolite tracking surveys are presented
in Table 2.22. Details on the survey
effort and CWD groups tracked are presented in Appendix D. The first sighting locations of
CWD groups tracked between April and June 2017 are shown in Figure 2.9.
Table 2.22: Summary of Survey Effort
and CWD Group of Land-based Theodolite Tracking
|
Land-based Station |
# of Survey Sessions |
Survey Effort (hh:mm) |
# CWD Groups Sighted |
CWD Group Sighting per Survey Hour |
|
April 2017 |
||||
|
Lung Kwu Chau |
3 |
18:00 |
6 |
0.33 |
|
Sha Chau |
2 |
12:00 |
0 |
0 |
|
TOTAL |
5 |
30:00 |
6 |
0.20 |
|
May 2017 |
||||
|
Lung Kwu Chau |
3 |
18:00 |
2 |
0.11 |
|
Sha Chau |
2 |
12:00 |
0 |
0 |
|
TOTAL |
5 |
30:00 |
2 |
0.07 |
|
June 2017 |
||||
|
Lung Kwu Chau |
3 |
18:03 |
9 |
0.50 |
|
Sha Chau |
2 |
12:00 |
0 |
0 |
|
TOTAL |
5 |
30:03 |
9 |
0.30 |
|
OVERALL |
15 |
90:03 |
17 |
0.19 |
Figure 2.9: Plots of First
Sightings of All CWD Groups from Land-based Stations
[Green triangle:
LKC station; Green square: CWD group off LKC; Blue line: SCLKCMP boundary]
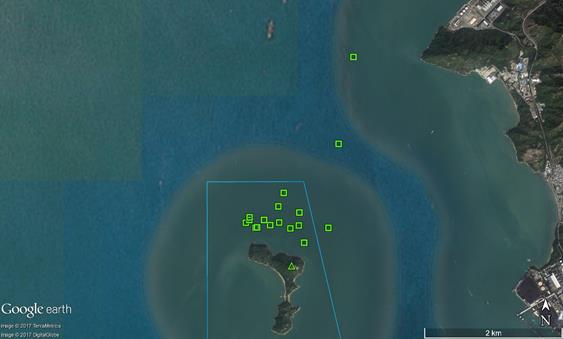
Progress Update on Passive Acoustic
Monitoring (PAM)
An Ecological Acoustic Recorder (EAR) has been
deployed and positioned to the south of Sha Chau Island with 20% duty cycle (Figure 2.10) with data from the EAR intended
primarily to supplement the data collected from the land-based theodolite
station on Sha Chau. The EAR deployment generally lasts around 4-6 weeks
followed by a period of data retrieval for subsequent analysis. As the data
analysis takes more than two months after retrieval, PAM results are not
suitable for reporting in quarterly reports. Detailed analysis of PAM
data will be presented in the annual CWD report to coincide and supplement the
data collected from the land-based theodolite survey station at Sha Chau.
Site Audit for CWD-related
Mitigation Measures
During this reporting period, silt curtains
were in place by the contractors for sand blanket laying works, in which at
least two dolphin observers were deployed by each contractor in accordance with
the MMWP. Teams of at least two dolphin observers were deployed for continuous
monitoring of the DEZ by the contractors for DCM and water jetting works for
submarine cable diversion in accordance with the DEZ Plan. Trainings for the
proposed dolphin observers on the implementation of MMWP and DEZ monitoring
were provided by the ET prior to the aforementioned works, with a cumulative total
of 408 individuals being trained and the training records kept by the ET.
From the contractors’ MMWP observation records and DEZ monitoring records, no
dolphin or other marine mammals were observed within or around the DEZ or silt
curtains in this reporting period. These contractors’ records were also audited
by the ET during site inspection.
Audits of acoustic decoupling for construction
vessels were carried out during weekly site inspection and summarised in Section 2.6. Summary
of audits of SkyPier High Speed Ferries route diversion and speed control and
construction vessel management are presented in Section 2.8 and Section 2.9 respectively.
2.6 Weekly Environmental Site Inspection
Site inspections of the construction works were
carried out on a weekly basis to monitor the implementation of proper
environmental pollution control and mitigation measures for the Project.
Bi-weekly site inspections were also conducted by the IEC. Observations
have been recorded in the site inspection checklist and passed to the
contractor together with the appropriate recommended mitigation measures where
necessary.
The key observations from site inspection and
associated recommendations were related to:
● provision and maintenance of drip trays,
spill kits, and chemical storage area; and
● implementation of dust suppression and noise
mitigation measures.
In addition, recommendations were provided
during site inspection on construction vessels, which include:
● display of relevant permit and licenses on
barges;
● display of Non-Road Mobile Machinery (NRMM)
labels for relevant mechanical equipment;
● provision and maintenance of storage area for
general refuse, chemicals, and chemical waste;
● segregation of recyclables from general refuse;
● proper implementation of acoustic decoupling
measures, wastewater treatment, DEZ monitoring, dust suppressing measures,
spill and runoff preventive measures, and dark smoke preventive measures; and
● proper installation and maintenance of
silt curtains.
The daily visual inspection
checklists for silt curtains and bi-weekly diver inspection records which were
implemented by the contractors in accordance with the Silt Curtain Deployment
Plan had been checked during site inspection and reviewed at the end of the
reporting period, summarizing that the silt curtains were maintained in the
correct positions and intact without obvious defects or damage.
A summary of implementation status
of the environmental mitigation measures for the construction phase of the
Project during the reporting period is provided in Appendix B.
2.7 Ecological Monitoring
No works were conducted on Sheung Sha Chau
Island during the ardeid’s breeding season in the reporting period in
accordance with the Updated EM&A Manual. No ecological monitoring was conducted
during the reporting period.
2.8
Audit of the SkyPier Plan
In total, 2,543 ferry
movements between HKIA SkyPier and Zhuhai / Macau were audited in the reporting
period. The daily movements of all SkyPier HSFs in the reporting period ranged between 56 and 97, which falls within the maximum daily cap
number of 125.
Except one HSF, all HSFs
travelled through the SCZ with average speed within 15 knots (7.8 knots to 14.3
knots), which complied with the SkyPier Plan. Nine ferry movements had minor deviations from the
diverted route during the reporting period. Notices
of speeding and routing deviation were sent to the FOs and the cases have been
investigated. The speeding case and all the deviation cases from the
diverted route were due to public safety considerations or emergency
situations, i.e., giving way to other vessels, and the HSFs had returned to the
normal route following the SkyPier Plan as soon as practicable. The summary of the
SkyPier Plan monitoring result (March 2017 to June 2017) is presented in Graph 3.
Insufficient Automatic
Identification System (AIS) data were received from some HSFs during the
reporting period. After investigation, it was found that missing of AIS data
for the concerned ferries were due to interference effect of AIS signal as
reported by the FO after checking the condition of the AIS transponders. Vessel
captains were requested to provide the radar track photos which indicated the
vessel entered the SCZ though the gate access points and no speeding in the
SCZ. Ferry operator’s explanation has been accepted.
Three meetings were held with
FO representatives in
June 2017 to review and discuss the deviation cases happened in the past few
months as well as to share experience and recommendations to further strengthen
the implementation of SkyPier Plan.
Graph 3: Summary of SkyPier Plan Monitoring Results
(March 2017 to June 2017)
2.9 Audit of Construction and Associated Vessels
On the implementation of
the Marine Travel Routes and Management Plan for Construction and Associated
Vessel (MTRMP-CAV), the
upgraded Marine Surveillance System (MSS) automatically recorded deviation
cases such as speeding, entering no entry zone, and not traveling through the
designated gate. ET conducted bi-weekly audit of
relevant information including AIS data, vessel tracks and other relevant
records to ensure sufficient information has been provided by the system and
the contractors complied with the requirements of the MTRMP-CAV. The contactors
have submitted endorsed 3-month rolling vessel plan for construction vessel
activities to AAHK in order to help maintain the number of construction vessels
to a practicable minimum. The IEC has also performed audit on the compliance of
the requirements as part of the EM&A programme.
Between April and June
2017, deviations including speeding in the works area, entry from non-designated
gates and entering no-entry zones were identified. All the concerned captains
were reminded by the contractor’s MTCC representative to comply with the
requirements of the MTRMP-CAV.
A total of 11 skipper
training workshops have been held by ET between April and June 2017 with 91
concerned captains of construction vessels associated with the 3RS Contracts to familiarise them with the predefined routes,
general education on local cetaceans, guidelines for avoiding adverse water
quality impact, the required environmental practices / measures while operating
construction and associated vessels under the Project, and guidelines for
operating vessels safely in the presence of CWDs. Another 18 skipper training
workshops have been held with 32 concerned captains by contractor’s
Environmental Officer (EO) and competency test had been conducted subsequently
with the trained captains by ET.
2.10 Coral Post-Translocation Monitoring
In accordance with the approved Coral
Translocation Plan (CTP), gorgonian corals suitable for translocation were
translocated to the recipient site at Yam Tsai Wan, which was completed in
January 2017. Since then the post-translocation monitoring program has been
commenced according to the CTP. Details of the coral translocation works
and the results of the first three rounds of post-translocation monitoring
conducted in the period from January to March 2017 are presented in the
Quarterly EM&A Report No. 5.
Monitoring Results
According to the CTP, the fourth round of
post-translocation monitoring was conducted on 5 and 6 April 2017 (about three
months after completion of translocation). The results of the fourth
round of post-translocation monitoring are summarized in Table 2.23. It was found in the fourth round
of monitoring that an significant increase in partial
mortality (PM) was recorded in both the translocated corals (tagged) and the
control corals (tagged), as well as deterioration in health conditions.
However, as the changes in PM were found at both translocated and control
corals (tagged), the action/ limit levels as defined in the CTP were not
triggered.
Nonetheless, the CTP stipulates that if
observations of any die-off / abnormal conditions of the translocated corals are
made during post-translocation monitoring, the ET shall inform AAHK, IEC and
AFCD and liaise with AFCD to investigate any mitigation measures needed.
The ET is also required to identify the source of the impact causing die-off /
abnormal conditions of the translocated corals and if it is related to the
Project. To this end, the ET has been investigating the significant
change in PM identified from the monitoring in April 2017 and has had a meeting
with AFCD and EPD in June 2017 to discuss the issue and the planned follow-up
actions.
The
investigation works completed or currently undertaken by the ET include:
● Ad-hoc initial check of the coral
conditions;
● Ad-hoc monitoring of all
translocated (tagged and untagged) and control corals;
● Ad-hoc dive check of natural corals
in Yam Tsai Wan, Sham Shui Kok and Tai Mo To;
● Ad-hoc water quality monitoring;
● Review of weather conditions, red
tide, water quality monitoring data;
● Substrate check and review of
sediment deposition;
● Review of other projects and their
translocated corals; and
● Consultation with coral experts on the
potential cause(s) of the significant change in PM.
Based on preliminary findings, the
condition of corals in May and June are not worsening compared to those in
April. As the investigation works are still underway, details of the
investigation results together with the ad-hoc monitoring results will be
presented in the next Quarterly EM&A Report.
Table 2.23: Summary of the
Post-Translocation Monitoring Surveys Completed in this Reporting Period
|
|
Colony Height (cm) |
General Health Conditions(a) |
% Change in Partial Mortality(b) (c) |
Exceedance of Action Level(d) |
Exceedance of Limit Level(e) |
|
Fourth Round of Survey in April 2017 |
|||||
|
Control gorgonian corals (tagged) |
7-59 |
0-3 (Average: 1.9) |
≤25% change for 5% of the tagged corals and >25% change for 95% of the tagged corals (Average PM: 73%) |
No
|
No
|
|
Translocated gorgonian corals (tagged) |
5-44 |
1-4 (Average: 2.0) |
≤25% change for 4.7% of the tagged corals and >25% change for 94.1% of the tagged corals (Average PM: 73%) |
||
Notes:
(a)
General health conditions of coral were measured on an ordinal scale of
0 to 5 (0=dead, 5=very healthy).
(b)
The percentage change in partial mortality of the tagged translocated
and control corals are both determined by comparing the partial mortality
recorded during each post-translocation monitoring with reference to the
partial mortality observed during the baseline conditions, as represented by
the tagged coral survey results.
(c)
Coral showing no change in partial mortality is not presented in this
account.
(d)
As defined in the approved CTP, the Action Level is exceeded if during
monitoring a 15% increase in the percentage of partial mortality occurs at more
than 20% of the translocated coral colonies that is not recorded on the
original (control) corals at the recipient site.
(e)
As defined in the approved CTP, the Limit Level is exceeded if during
monitoring a 25% increase in the percentage of partial mortality occurs at more
than 20% of the translocated coral colonies that is not recorded on the
original (control) corals at the recipient site.
2.11 Review of the Key Assumptions Adopted in the EIA Report
With reference to Appendix E of the Manual, it
is noted that the key assumptions adopted in approved EIA report for the
construction phase are still valid and no major changes are involved. The
environmental mitigation measures recommended in the approved EIA Report remain
applicable and shall be implemented in undertaking construction works for the
Project.
3
Report on Non-compliance,
Complaints, Notifications of Summons and Prosecutions
3.1
Compliance with Other Statutory Environmental Requirements
During the reporting period, environmental
related licenses and permits required for the construction activities were
checked. No non-compliance with environmental statutory requirements was
recorded.
3.2
Analysis and Interpretation of Complaints,
Notification of Summons and Status of Prosecutions
3.2.1 Complaints
An environment-related complaint was received on 24 April 2017 regarding
dolphin watching arrangement for implementation of Dolphin Exclusion Zone (DEZ)
in area of Contract 3204 for the period since early March 2017. Investigation
was conducted by the ET in accordance with the Manual and the Complaint
Management Plan (CMP) of the Project. The ET’s review of checking records
indicated that the DEZ monitoring arrangements of Contract 3204 for March and
April 2017 were reviewed by the ET and IEC, based on the requirements of the
DEZ Plan and prior to the Contractor’s implementations and noted the
arrangements had followed the DEZ Plan. Furthermore, the implementation of DEZ was
checked by the ET on-site during the regular and ad-hoc site inspections for
Contract 3204 and noted the site practices had followed the proposed DEZ
monitoring arrangements and in line with the DEZ Plan. Based on the
investigation results, it is concluded that the 3204 Contractor deployed
sufficient dolphin watching arrangements for implementation of DEZ during March
and April 2017 and had followed the DEZ Plan. The complaint case was considered
unfounded. Regular monitoring and mitigation measures continue.
Another environment-related complaint was received on 9 May 2017
regarding the intermittent release of exhaust air emissions from marine
construction vessels of the Project. Investigation was conducted by the ET in
accordance with the Manual and the CMP of the Project. The anonymous
complainant did not provide any information on the case (e.g. date/time) or any
details of the mentioned vessel types. There were no observations of dark smoke
during ET’s site inspection in May 2017. ET will continue the regular auditing,
which involves weekly and ad-hoc site inspections to, among other matters,
check for any dark smoke emission from construction vessels, and to inspect
vessels’ maintenance records. In case where dark smoke emission from a construction
vessel is observed, the ET will require the concerned contractor to take
immediate action to rectify the situation.
Lastly, an environment-related complaint was received on 22 May 2017
regarding alleged cement discharges from a construction vessel during
reclamation activities of the Project. Investigation was conducted by the ET in
accordance with the Manual and the CMP of the Project. The anonymous
complainant did not provide any information on the case (e.g. date/time of the
observation) or any details of the vessel (e.g. name, description or
characteristics of the vessel, etc.). The ET recognized the concerned vessel as
a DCM barge. Review of the water quality monitoring results in April and
May 2017 indicated that there were no exceedances of Action or Limit levels for
total alkalinity in those two months, hence no indications suggesting
significant discharge of cement into the marine environment. Also, there were no discharge out of the site boundary of the Project
observed during the water quality monitoring events. Nevertheless, the ET has
reminded and reiterated to the DCM contractors to ensure proper implementation
of the relevant precautionary/ mitigation measures including the deployment of
primary silt curtains installed on their DCM barges and maintaining good
housekeeping to avoid spillage/leakage of untreated wastewater/materials into
the surrounding marine environment. The ET observed that the relevant
precautionary/ mitigation measures had been carried out by the DCM contractors.
The ET continues to monitor the implementation and effectiveness of the
relevant precautionary/ mitigation measures during the regular and ad-hoc site
inspections.
3.2.2 Notifications of Summons or Status of Prosecution
Summons were received in June 2017 alleging use of powered mechanical equipment
outside the permitted hours for the aviation fuel pipeline diversion works in
December 2016.
3.3
Cumulative Statistics
Cumulative
statistics on exceedance, non-compliance, complaints, notifications
of summons and status of prosecutions are summarized in Table 3.1 and Table 3.2.
Table 3.1: Statistics for Valid
Exceedances for the Environmental Monitoring
|
|
|
Total No. Recorded in the Reporting Period |
Total No. Recorded since the Project Commenced |
|
1-hr TSP |
Action |
0 |
0 |
|
|
Limit |
0 |
0 |
|
Noise |
Action |
0 |
0 |
|
|
Limit |
0 |
0 |
|
Waste |
Action |
0 |
0 |
|
|
Limit |
0 |
0 |
|
Water |
Action |
0 |
0 |
|
|
Limit |
0 |
0 |
|
CWD |
Action |
0 |
0 |
|
|
Limit |
0 |
0 |
Remark: Exceedances
which are not project related are not shown in this table.
Table 3.2: Statistics for
Non-compliance, Complaints, Notifications of Summons and Prosecution
|
Reporting Period |
Cumulative Statistics |
|||
|
|
Non-compliance |
Complaints |
Notifications of Summons |
Prosecutions |
|
This reporting period |
0 |
3 |
1 |
0 |
|
From 28 December 2015 to end of the reporting period |
0 |
5 |
1 |
0 |
4 Conclusion and Recommendation
In this quarterly period from 1 April 2017 to
30 June 2017, the EM&A programme has been implemented as planned, including
105 sets of air quality measurements, 65 sets of construction noise
measurements, 37 sets of water quality measurements, 6 complete sets of vessel
line-transect surveys and 15 days of land-based theodolite tracking survey
effort for CWD monitoring, as well as environmental site inspections and waste
monitoring for the Project’s construction works.
Key activities of the Project carried out in
the reporting period included DCM trials and works, laying of geotextile and
sand blanket, site office establishment, HDD works, and submarine cable
diversion associated works.
Three Limit Level exceedance cases of 1-hour
TSP were recorded in the reporting period, and the corresponding investigations
were conducted accordingly. The investigation findings concluded that the
exceedances were likely due to the adverse ambient air quality, but not due to
the Project.
For water quality, the water quality monitoring
results for total alkalinity obtained during the reporting period did not
exceed their corresponding Action and Limit Levels stipulated in the EM&A
programme for triggering the relevant investigation and follow-up procedures
under the programme if being exceeded. For DO, turbidity, SS chromium, and
nickel, some of the testing results exceeded the relevant Action or Limit
Levels in the reporting period, and the corresponding investigations were
conducted accordingly. The investigation findings concluded that the
exceedances were not due to the Project.
No breach of the Action or Limit Levels in
relation to the construction noise, waste and CWD monitoring were recorded
during the reporting period. All site observations made by the ET were
recorded in the site inspection checklists and passed to the contractor
together with the recommended follow-up actions.
In total, 2,543 ferry movements
between HKIA SkyPier and Zhuhai / Macau were audited in the reporting period.
Except one HSF, all HSFs travelled through the SCZ with average speed within 15
knots, which complied with the SkyPier Plan, except one HSF. Nine ferry movements had minor deviations from the
diverted route during the reporting period. ET investigated
the speeding and deviation cases and all of them are related to public safety / emergency situations.
Between April and June 2017, ET has
conducted bi-weekly audit of the MSS to ensure the system records all deviation cases
accurately and the contractors fully complied with
the requirements of the MTRMP-CAV. A
total of 11 skipper training workshops have been held by ET between April to June 2017 with concerned captains of construction
vessels associated with 3RS contracts. Another
18 skipper training workshops have been held by contractors’ EO and competency
test had been conducted subsequently with the trained captains by ET.
On the implementation of MMWP, silt curtains
were in place by the contractors for laying of sand
blanket and dolphin observers were deployed in accordance with the plan. On the
implementation of DEZ Plan, dolphin observers were deployed for continuous
monitoring of the DEZ by the contractors for DCM and water jetting works for
submarine cable diversion in accordance with the DEZ Plan. Trainings for the
proposed dolphin observers were provided by the ET prior to the aforementioned
works, with the training records kept by the ET. From the contractors’
MMWP observation records and DEZ monitoring records, no dolphin or other marine
mammals were observed within or around the silt curtains in this reporting
period.
Subsequent to completion of
the coral translocation works according to the approved CTP, a summary of the
ensuing post-translocation monitoring is reported quarterly.
The recommended environmental mitigation
measures, as included in the EM&A programme, have been effectively
implemented during the reporting period. Also, the EM&A programme
implemented by the ET has effectively monitored the
construction activities and ensure the proper implementation of mitigation
measures.